Benchmark your growth against what is actually working.
The Hawke Market Vision Report distills performance data across industries, platforms, and spend levels into clear benchmarks and strategic direction for 2026.
- Understand what “good” looks like for CAC, ROAS, CTR, and CVR
- Identify where efficiency is breaking down in your funnel
- Prioritize fixes before scaling spend further
Real benchmarks, not opinions
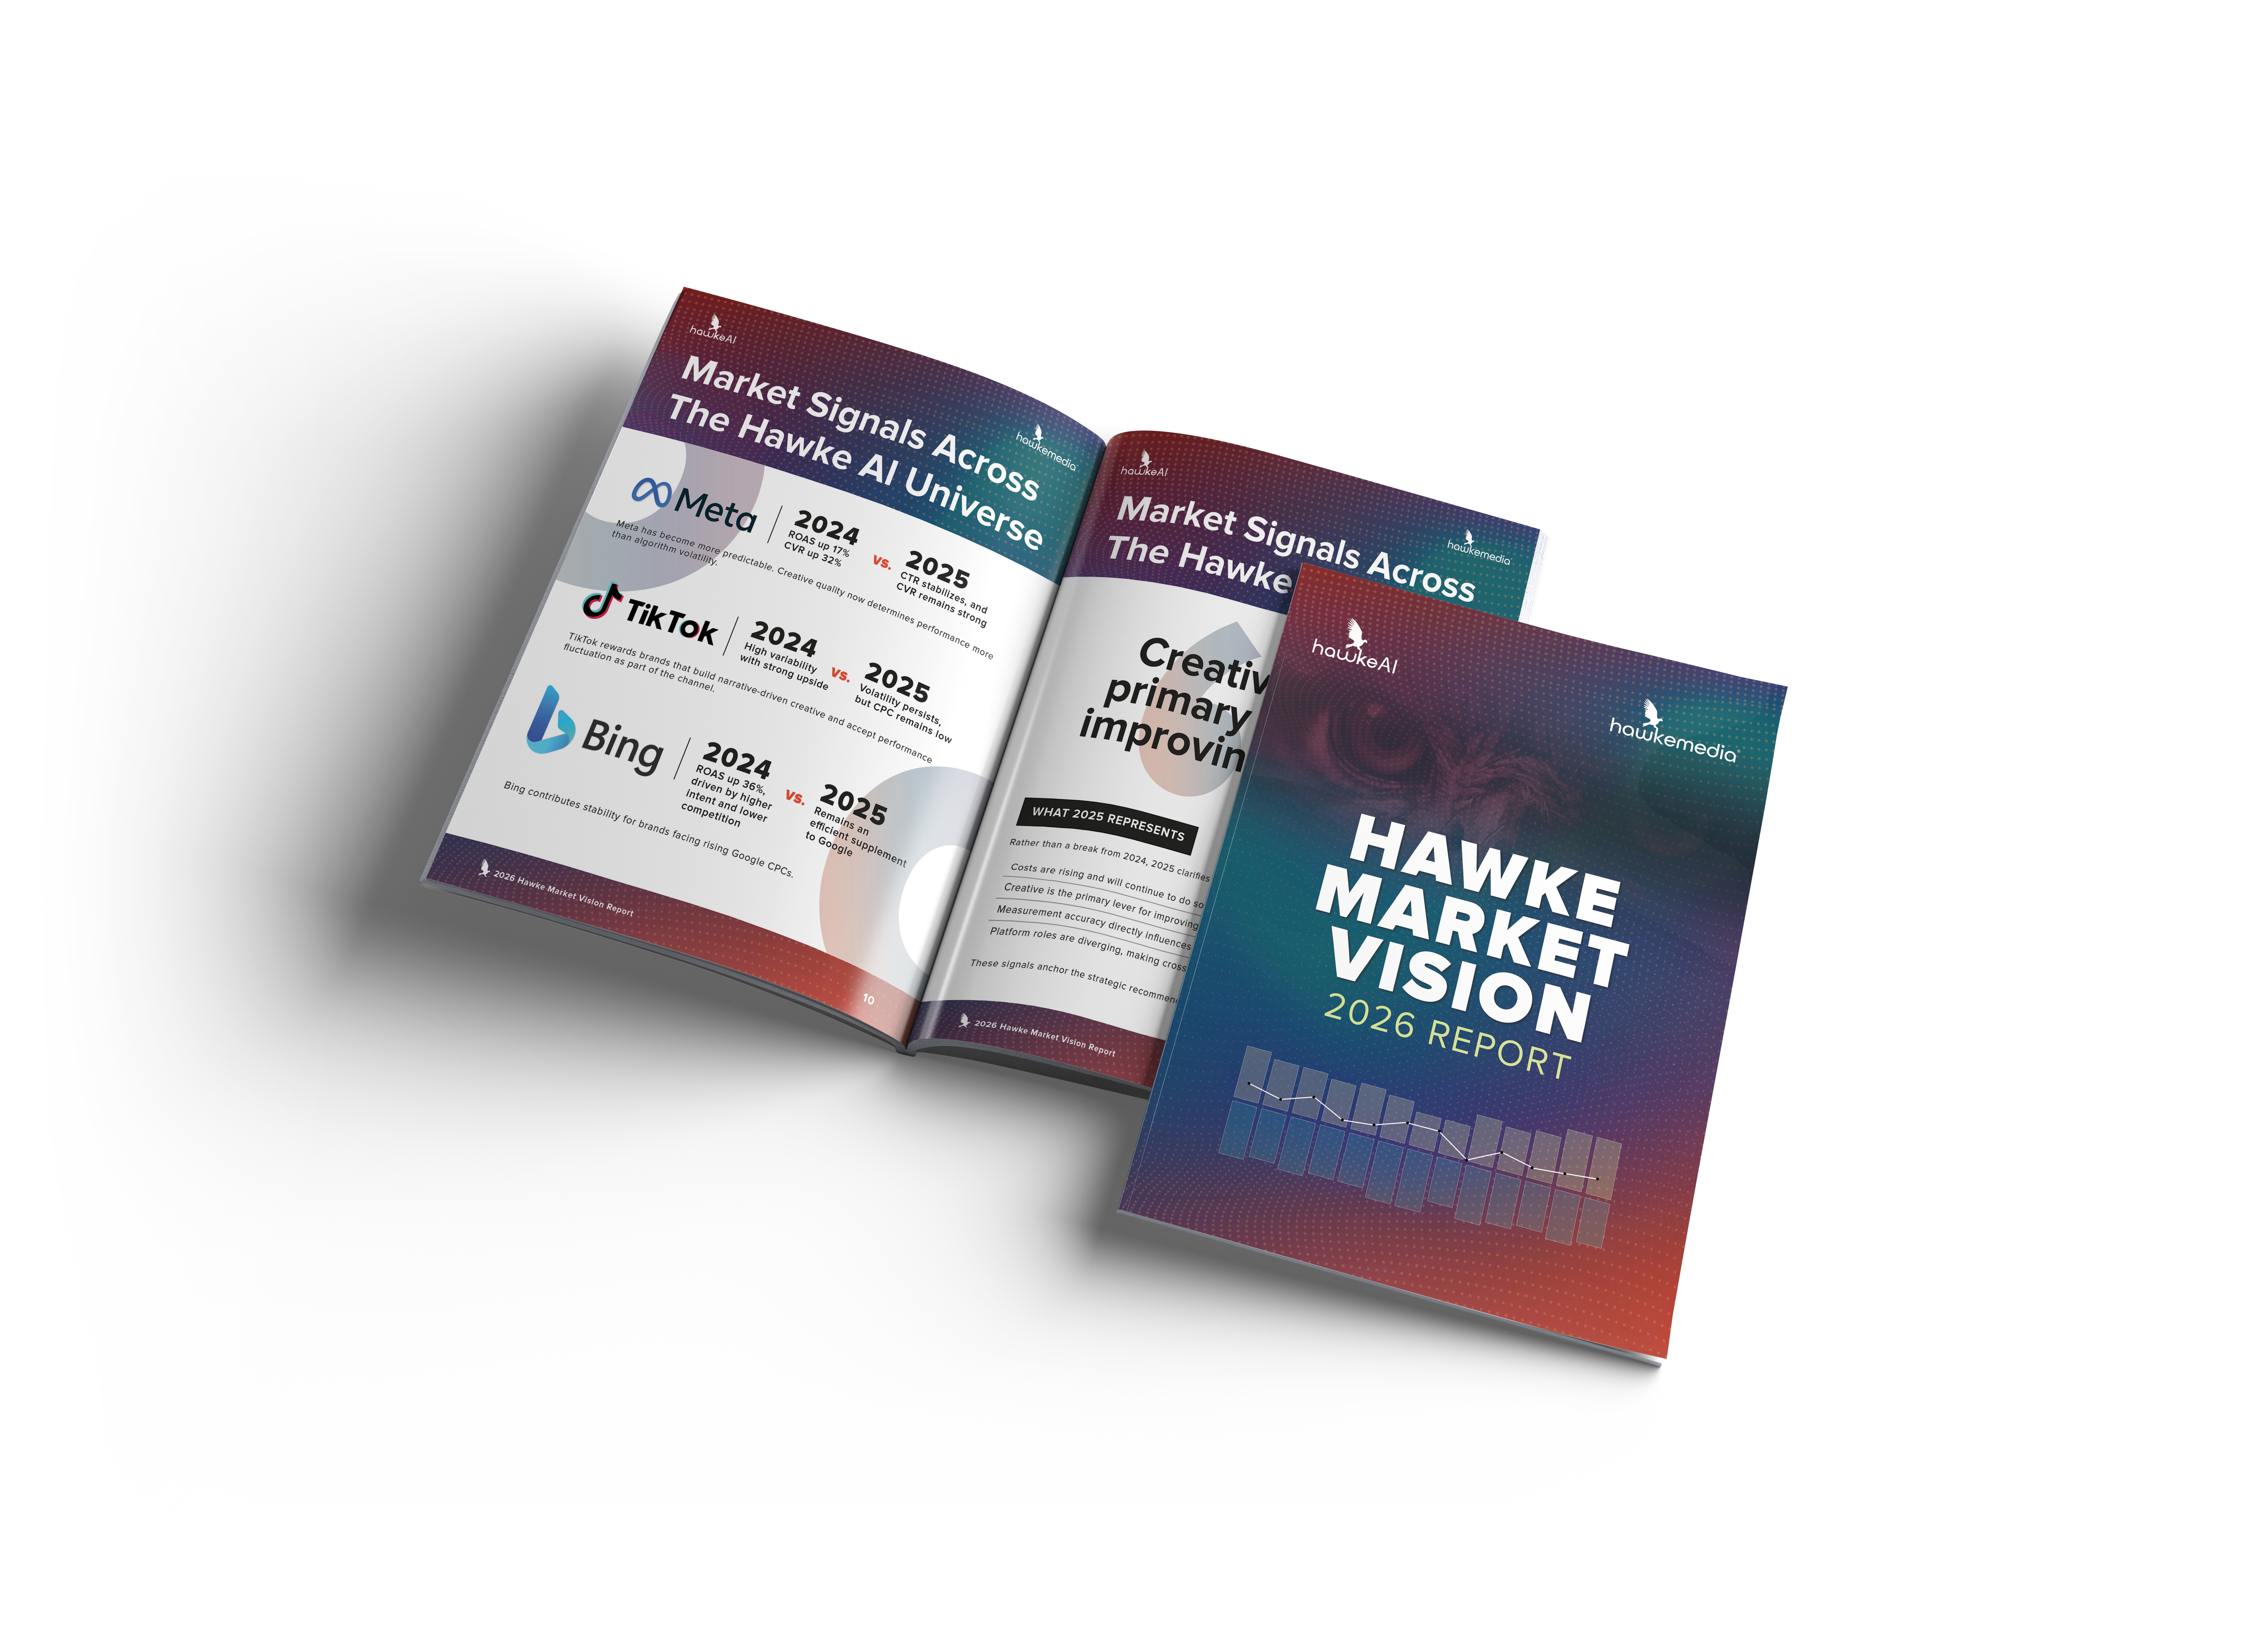
Built from live performance data across Google and Meta, segmented by vertical and business model.
A clear prioritization framework
Understand which lever to pull first before increasing budget or creative volume.
Designed for operators
Built for founders, CMOs, and growth teams responsible for CAC and profitability.
Benchmark preview
A snapshot of the performance signals included in the report. Use these to sanity-check performance, then apply the framework to decide what to fix first.
Ecommerce Google Ads ROAS
4.6
Efficiency is earned in the funnel, not wished into bids.
Ecommerce Google Ads CPC
$0.87
Lower CPC shifts pressure to CVR and AOV.
B2C Google Ads CVR
9.9%
Offer clarity and landing relevance drive conversion lift.
B2B Google Ads CPC
$2.68
Intent costs more. Messaging and lead quality gates matter.
Find the constraint before you scale.
If CAC is creeping up or performance feels unpredictable, this report gives you clarity fast.