The Growth Ceiling Calculator: How High Can You Fly?

FREE DIAGNOSTIC · FIVE INPUTS · 90 SECONDS
Find the revenue number
where your growth stops.
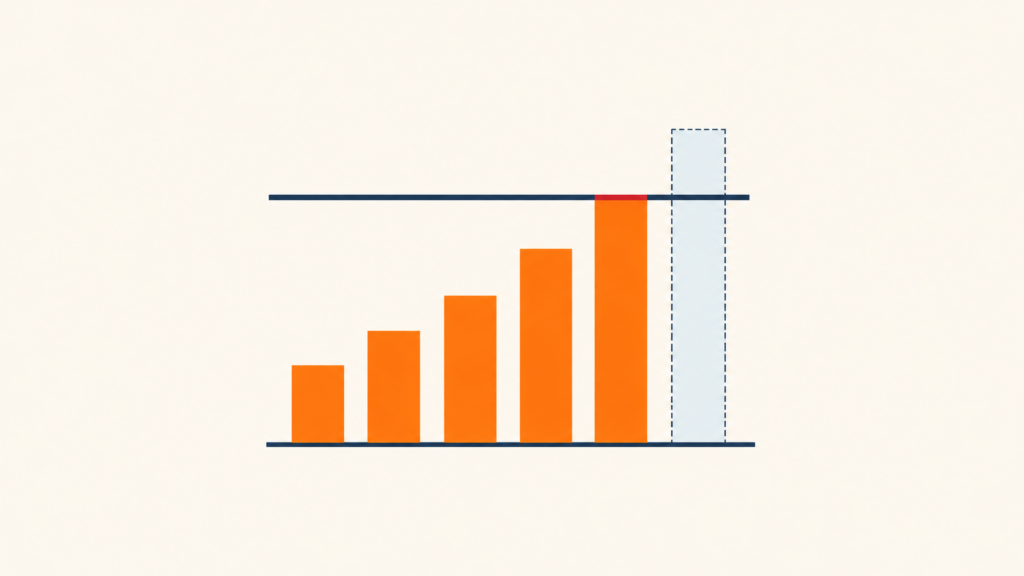
Every acquisition model has a ceiling. As spend scales inside a channel, the cheapest customers get bought first, and each new customer costs more than the last. At a specific spend level, the next customer costs more than they are worth, and growth stops. This calculator estimates that level for your business using five numbers you already know.
Your current model
Total acquisition spend divided by new customers
First purchase included
This is a directional range built on your current channel mix and standard saturation curves. New channels, stronger creative, and better retention all move it. Precise answers require your actual account data.
Why growth stalls before founders expect it to
Paid acquisition follows a saturation curve. The first dollars of spend reach your most eager buyers: warm audiences, high-intent searches, lookalikes built on your best customers. Those customers are cheap. As spend grows, the platform has to reach colder and broader audiences to spend your budget, and your cost per acquisition climbs. This pattern shows up in nearly every ad account at scale, and it is the reason a brand can double spend and see revenue grow only 40 percent.
The ceiling arrives at the intersection of two numbers: the rising cost of your next customer, and the fixed amount that customer is worth after margin. When those lines cross, additional spend buys revenue that costs more than it returns. Most growth-stage teams feel this months before they can name it. Return on ad spend drifts down, creative refreshes buy smaller and shorter recoveries, and the growth targets that were easy at $2M become grinding at $8M.
The math is not a verdict. It is a description of your current mix. Brands raise their ceilings constantly, and the next section covers the three levers that do it.
Three levers raise the ceiling. Nothing else does.
1. Lower the curve
Better creative, sharper targeting, and new channels reset your CAC curve at a lower starting point. A brand that adds a working second channel can often buy 30 to 50 percent more customers before hitting the same marginal cost.
2. Raise customer value
Retention, subscription offers, bundles, and post-purchase flows increase what each customer is worth, which raises the CAC you can afford to pay. Moving from 2.0 to 2.6 orders per customer per year lifts the ceiling on every channel at once.
3. Protect margin
Pricing, offer structure, and cost of goods determine how much of each order survives to pay for acquisition. A five-point margin gain works exactly like a five-point CAC cut, and it compounds with the other two levers.
How the calculation works
The model treats CAC as a function of spend: CAC(S) = CAC₀ × (S / S₀)α, where α is a saturation elasticity that controls how fast costs rise as spend scales. The range you see spans α = 0.35, which describes efficient scaling with strong creative and broad audiences, to α = 0.55, which describes fast saturation in a narrow niche or a single channel. These values are consistent with diminishing-returns patterns observed across paid media.
Growth stops where the marginal customer's cost equals their margin-adjusted contribution: average order value, times orders per year, times gross margin. The calculator solves for the spend level where that happens under each elasticity and reports the resulting monthly revenue as a range. Version one uses industry-standard curves. Calibration against real account data by vertical and spend tier is planned for version two.
Your ceiling is a starting point, not a verdict.
Talk through your numbers with a growth strategist and find the lever that moves yours first.
Book a free growth consultation